


POPULATION • URBAN SHARE
Growth lands in cities
Urban growth share
Most people now live in cities, a first in history. Lagos has 17.2 million people and is projected to reach nearly 90 million by , more than four times metro New York today. and challenge every city.

Climate damage mounts; policy lags. set no fossil-fuel roadmap. is in reverse. Current policies point past 1.5°C. Floods, heat and water shortages cost lives. AI moves at hyperspeed, with less coordination and existential warnings.
Our answer: economics. Inaction costs: Swiss Re estimates unchecked warming could cut global GDP $23 trillion by 2050. Action is a market: our AI-assisted projections show $43.3 trillion a year in urban solutions by 2050. Invent.City will build it in New York.
Strategy: turn vacant FiDi offices into a permanent marketplace where agencies, utilities, owners and developers see, test and buy, and suppliers reach buyers worldwide. Subway, road and ferry links deliver buyers; Wall Street makes FiDi famous.

The payoff for New York: a powerful economic engine. From the Trade Mart and the visitors it draws: 13,173 jobs, $2.4B a year in direct economic activity, $219M a year in taxes and fees. Base-case planning estimates, not forecasts. Section 4 shows the math.
Four steps, each building the market for the next. Events and media test demand cheaply. The Trade Mart makes it permanent on FiDi's vacant floors. A cluster grows around the Mart. FiDi becomes a model city.


Economics drives action, and a sound investment attracts more capital. Invent.City tests demand with events before committing major capital. The events will gather research from New York’s civic community, build support and test early revenue, building on a 2023–2024 market test on micro cargo and urban hubs. The roundtable series, set for early 2027, will follow three themes: the Cities that buy, the Forces that drive demand and the Industries that supply.

Growth lands in cities
Warming is still a choice
Economics drives action

Cities are growing at breakneck speed, mostly in Africa and South Asia. Lagos has about 17.2 million people today and is projected to reach nearly 90 million by 2100. These cities need working systems faster than procurement delivers. Bikeshare and light freight, for example, move people and goods without widening roads. Developed cities like New York and London face a different task: rebuilding aging systems while millions keep living and working in them.
City Population Evolution
Growth lands in cities
Africa shapes the century
Climate and AI are reshaping New York and cities worldwide. Energy demand, demographics, technology, economics, geopolitics and social change add pressure, and amplifies it.

Invent.City's events will focus on climate and AI and track the rest, pointing suppliers and capital to the most urgent purchases. shows how fast these industries scale: it produced 70% of the world’s electric cars and more than 80% of its battery cells in 2025, according to the IEA.
CO₂ sets new records
Seas rise faster
Warming is still a choice
Renewables win on cost
EV adoption is uneven
Local warming
AI optimizes city systems
AI stretches scarce capacity
NYC’s AI upside
Growth lands in cities
Africa shapes the century
Displacement keeps rising
Electricity demand
Crossing the chasm
Damaged cities


A Trade Mart brings buyers and sellers together: a permanent marketplace of showrooms, demonstrations and industry events, in one building or across several. Chicago's The Mart, Atlanta's AmericasMart and Dallas Market Center have run the model for decades. Invent.City will apply it to urban solutions in vacant FiDi offices, giving agencies, owners, developers and utilities one place to discover, evaluate and buy. Media, online tools and AI will extend its reach around the world and around the clock.
RAI

Chelsea Harbour

The Mart

Dallas Market Center

PDC

World Trade Centre

Hannover Messe

AmericasMart
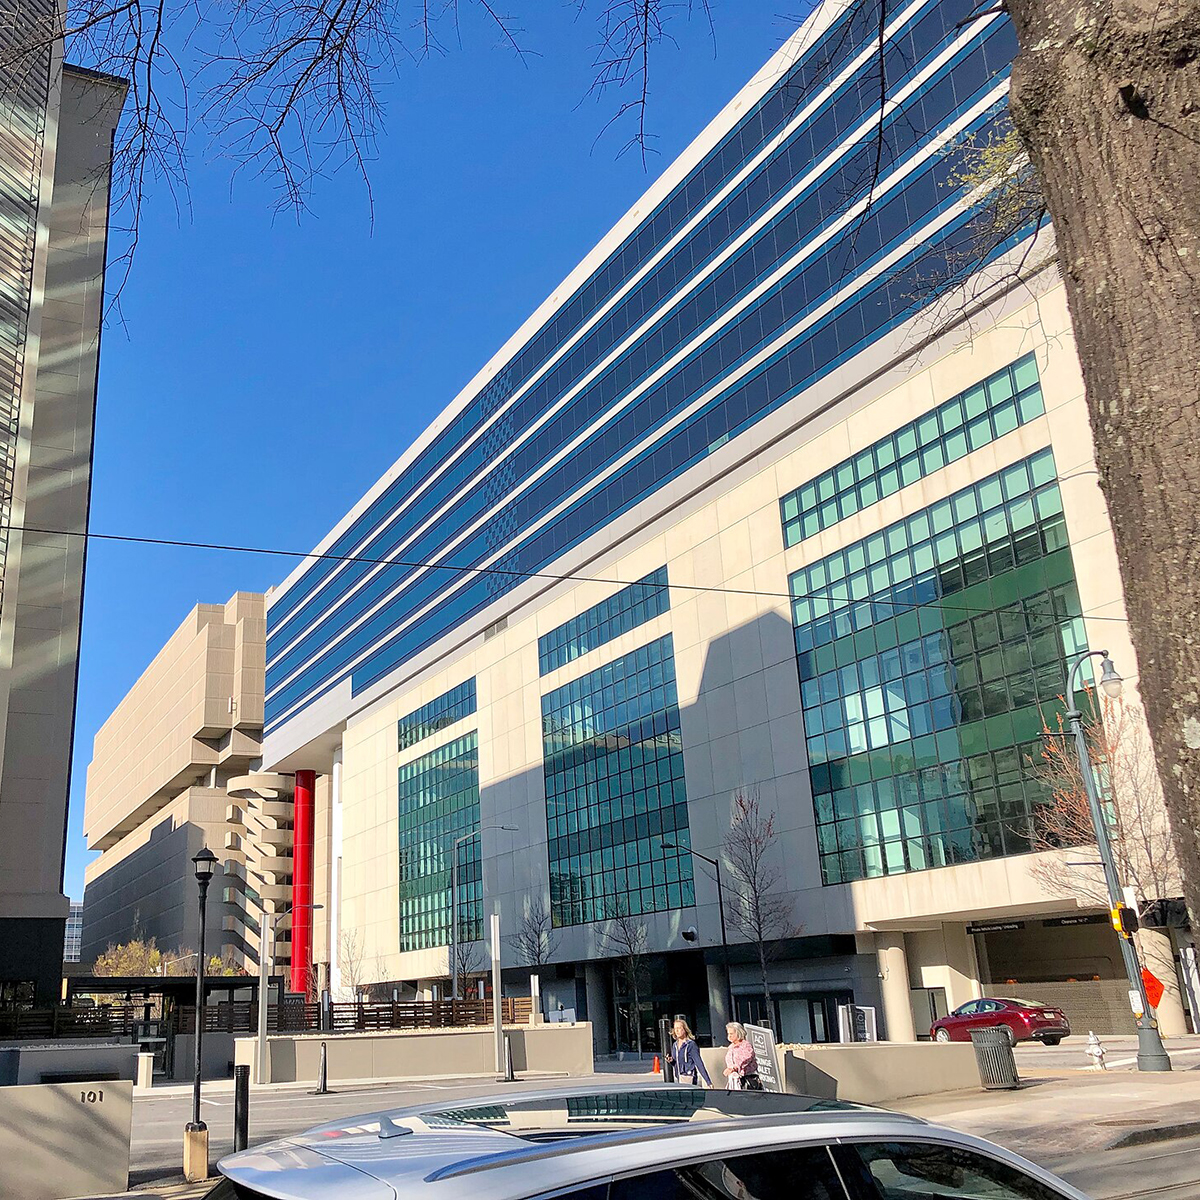
FiDi has the space, the transit and the address. Subways, ferries and bikeshare connect it to the city; City Hall and Wall Street put exhibitors next to decision-makers and capital. In the project area, east of Broadway and south of the Brooklyn Bridge on-ramp, about 27% of was vacant in Q2 2026, per Cushman & Wakefield. Many buildings can host the Mart, so Invent.City can move with the market, and New York itself will become the testing ground and showcase.
Transit


Open Space

Logistics
Institutions
Flood Defense

Global Reach


Showrooms are the heart of the Trade Mart. Companies will lease and run that make solutions tangible: visitors will walk through an energy-efficient apartment, explore a working urban farm, feel a cooler streetscape or run a simulated city operations center. New York's set the precedent. GM's Futurama (1939) carried visitors over a model future city; GE's Progressland (1964–65) showed electricity changing daily life.
Crossing the chasm
Reconfigure a full-scale street, then watch how curbs, micromobility, shuttles, charging, transit technology, and wayfinding reshape movement in real time.
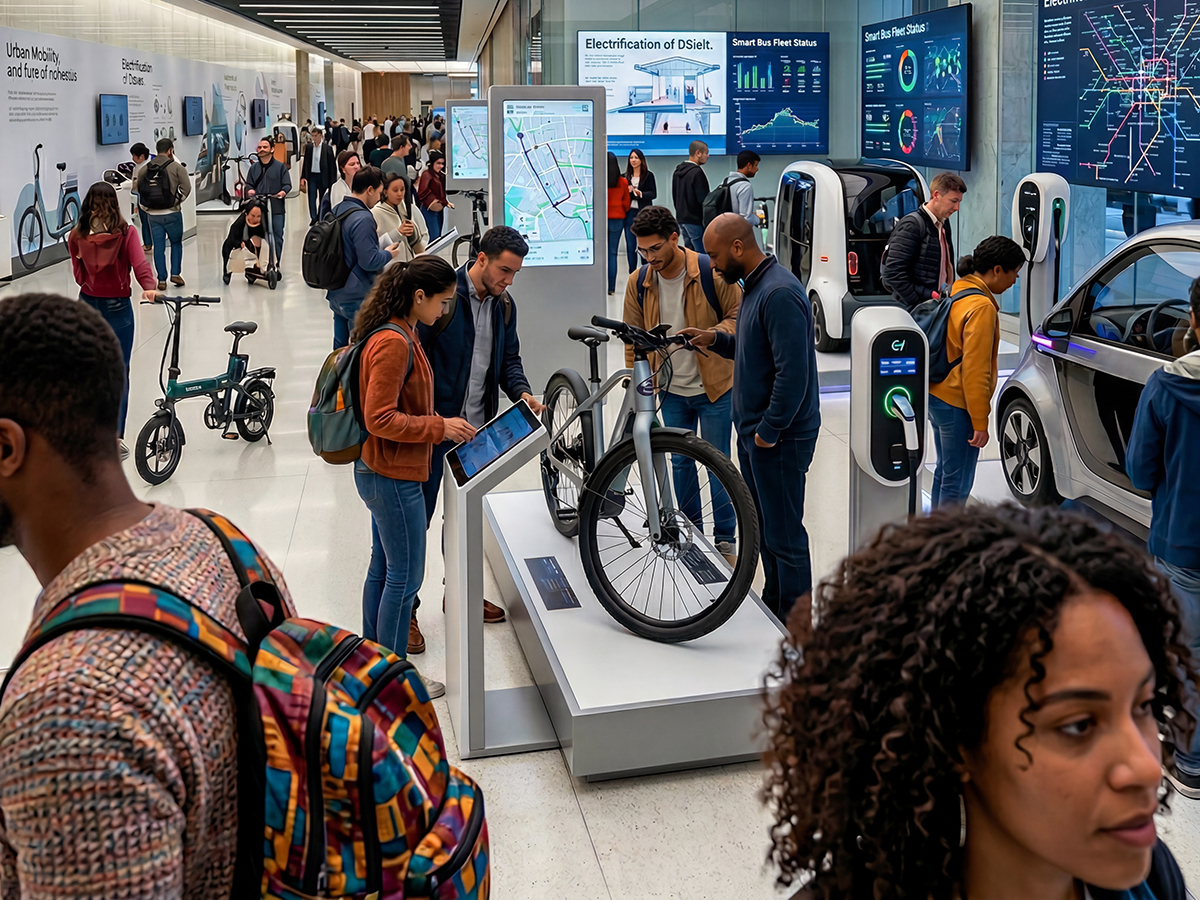
Turn up the heat, cut the power, and adjust controls inside occupied-room simulations to see how building systems protect comfort and continuity.
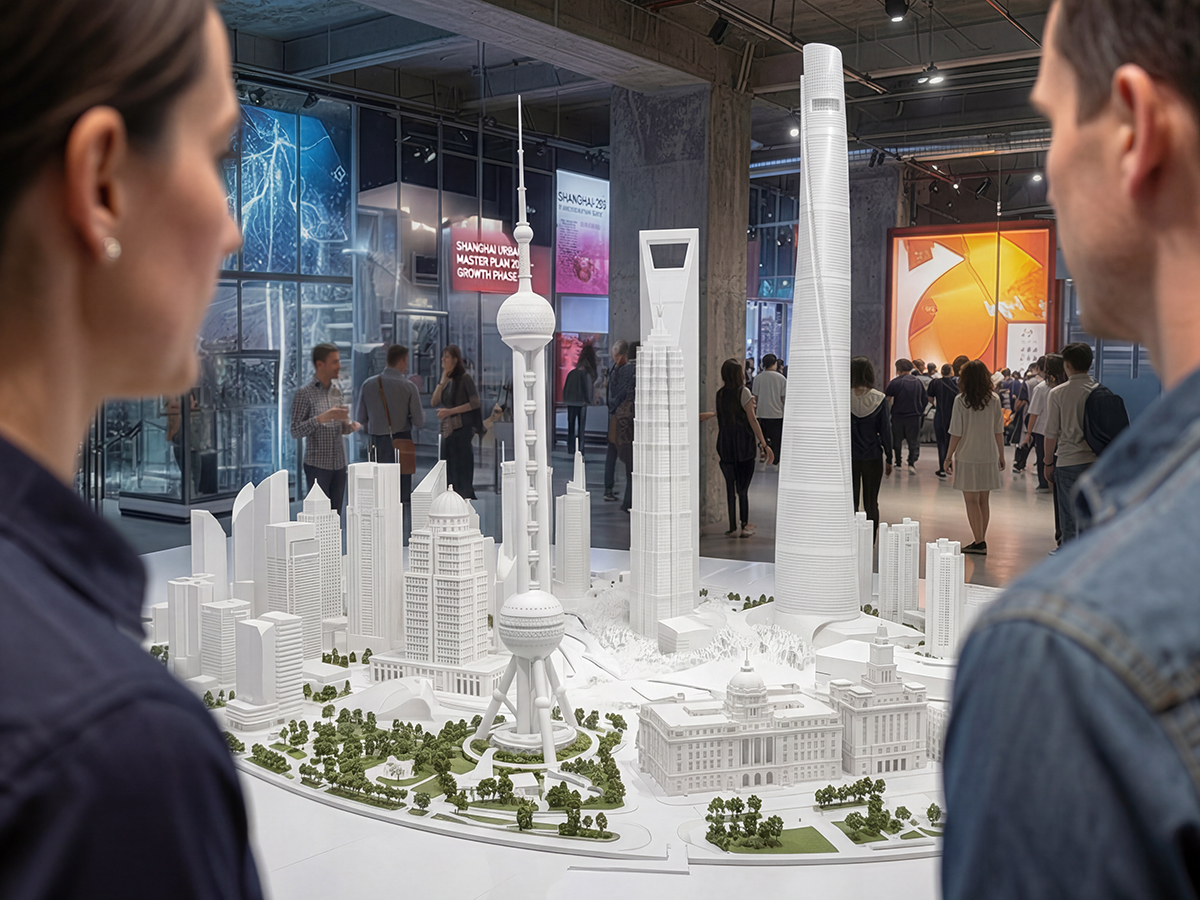
Balance generation, storage, microgrids, charging, and demand from a live control room, then stage an outage to see which systems keep the district running.

Send materials through collection, sorting, composting, reuse, and energy recovery, tracing where contamination appears and where discarded material becomes a valuable input.
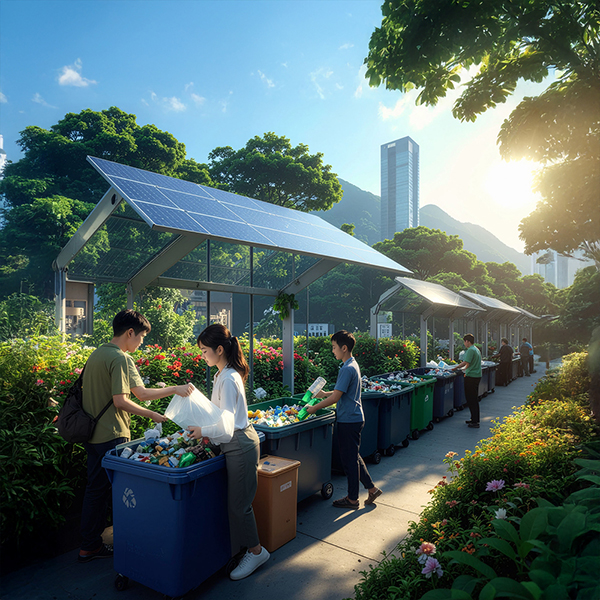
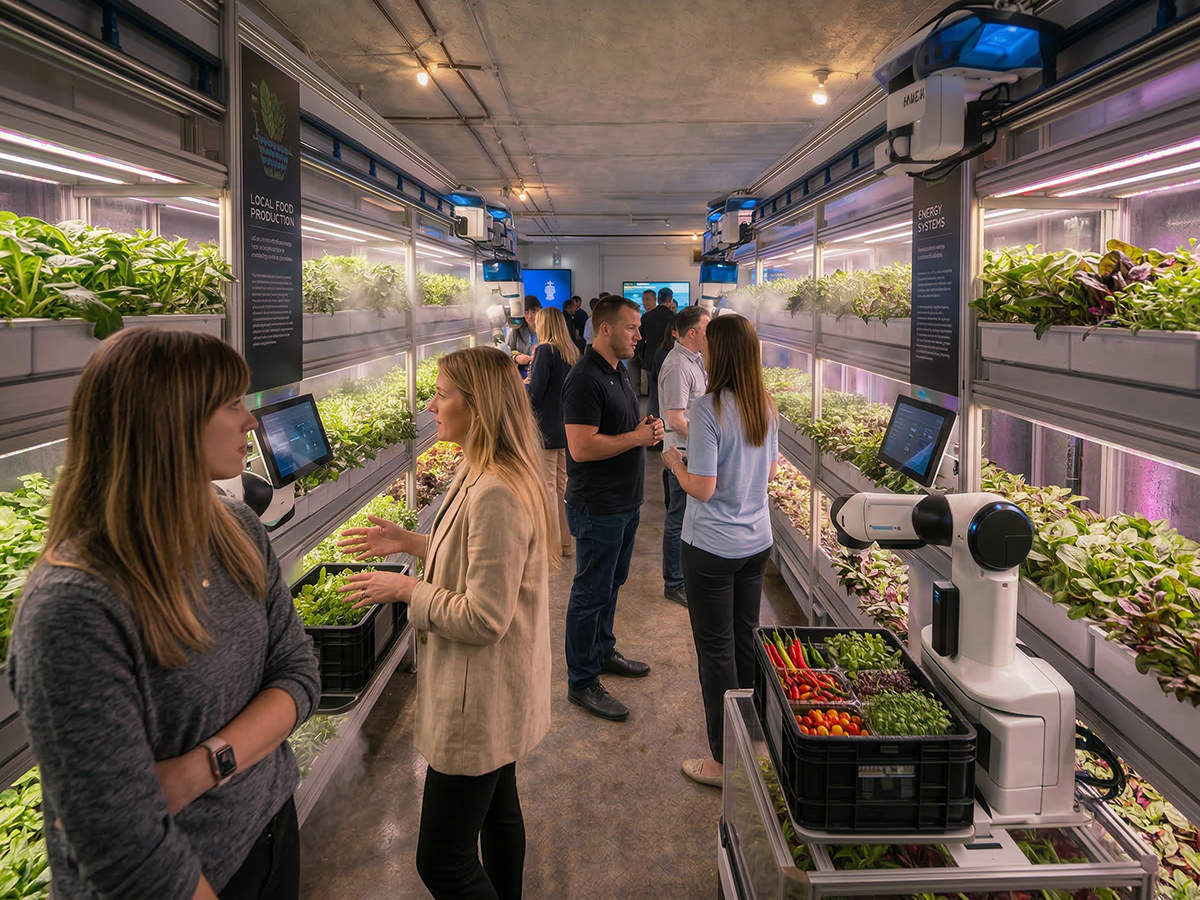
Harvest from working grow rooms, taste the output, and trace water, energy, compost, labor, and cold-chain decisions from seed to sale.
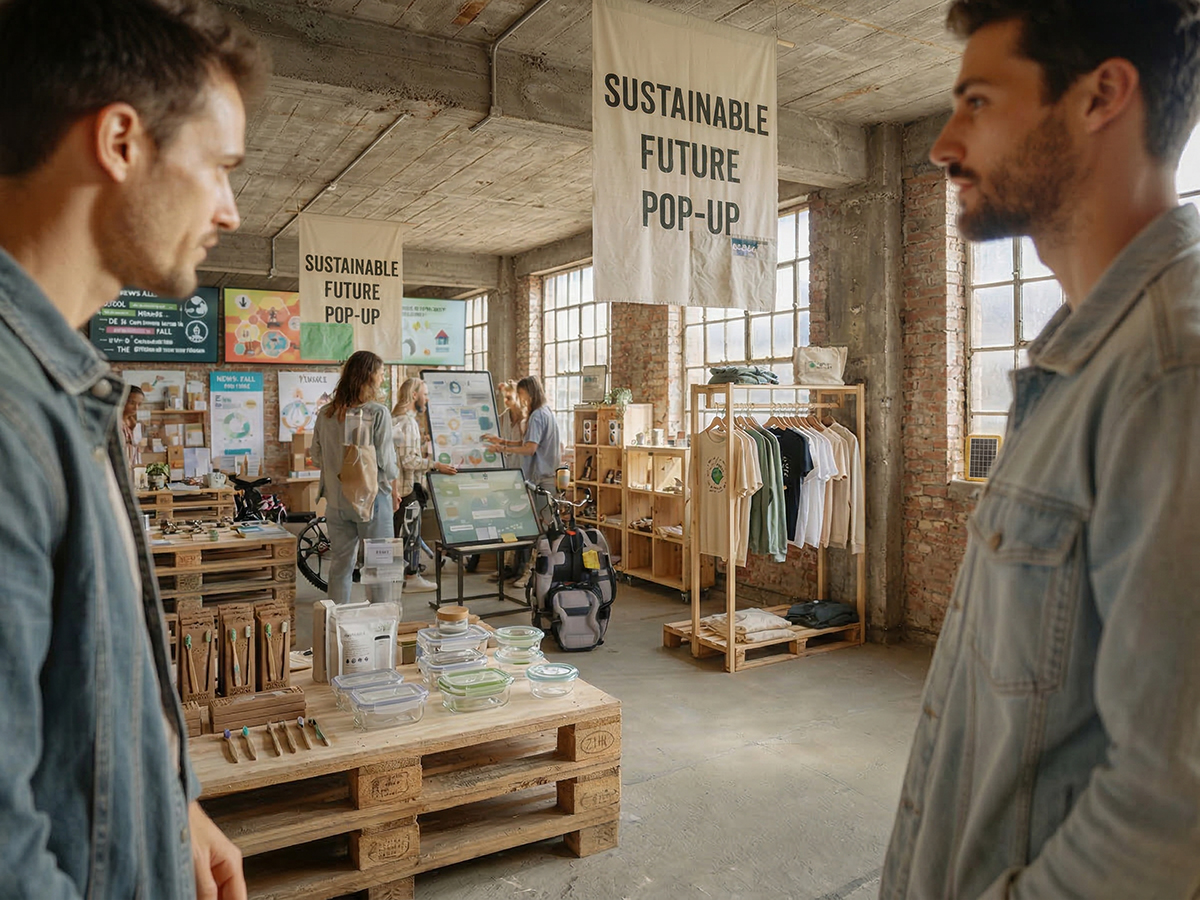
Use low-waste products inside apartment, hotel, office, and retail settings, revealing how they perform where residents, guests, employees, and customers encounter them.
Combine solar, heat pumps, thermal storage, smart meters, and efficiency controls in a building-scale lab, then tune the system through changing demand.
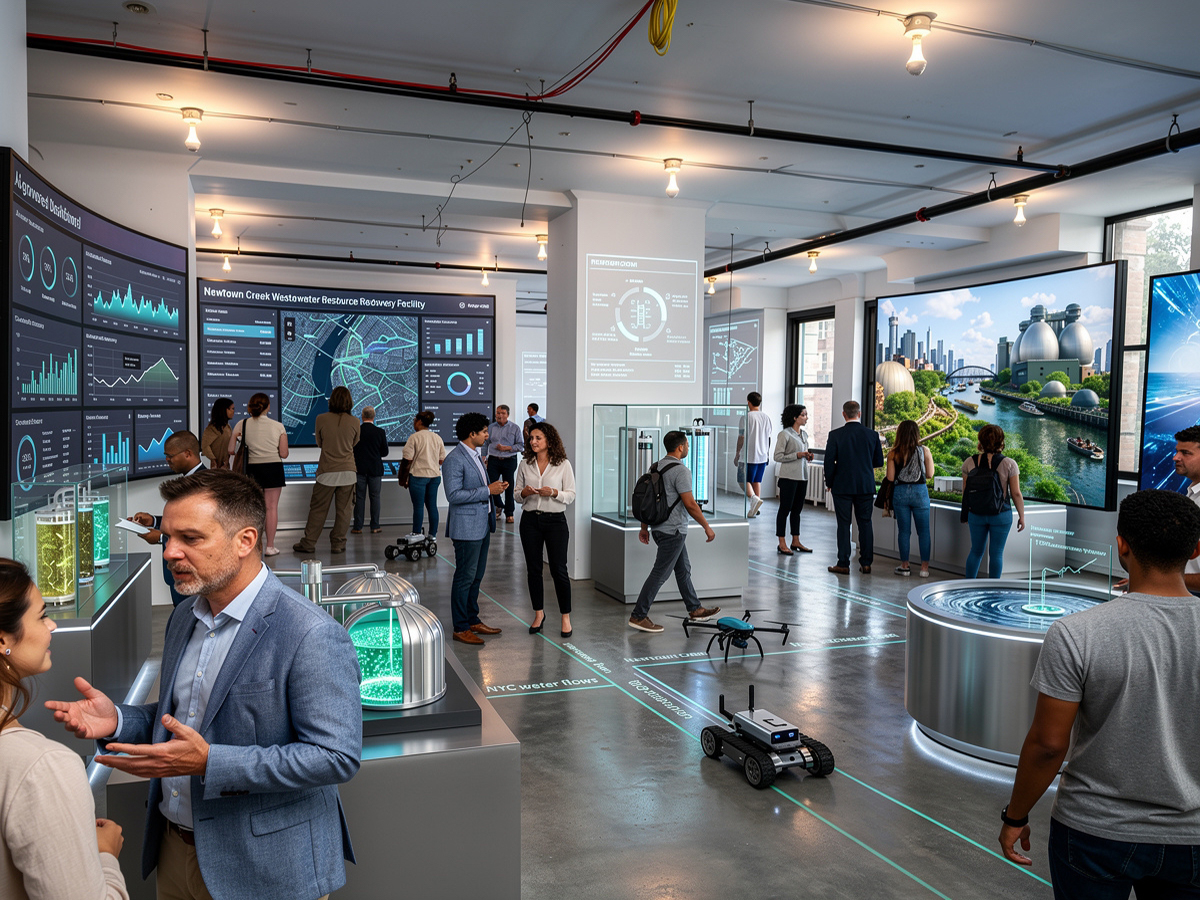
Trigger a cloudburst and heat wave across a working streetscape, then watch drainage, cooling, leak detection, irrigation, reuse, and flood protection respond together.
Follow a single stream through sensing, treatment, reuse, and nutrient recovery, seeing what can return safely to buildings, landscapes, or industry.
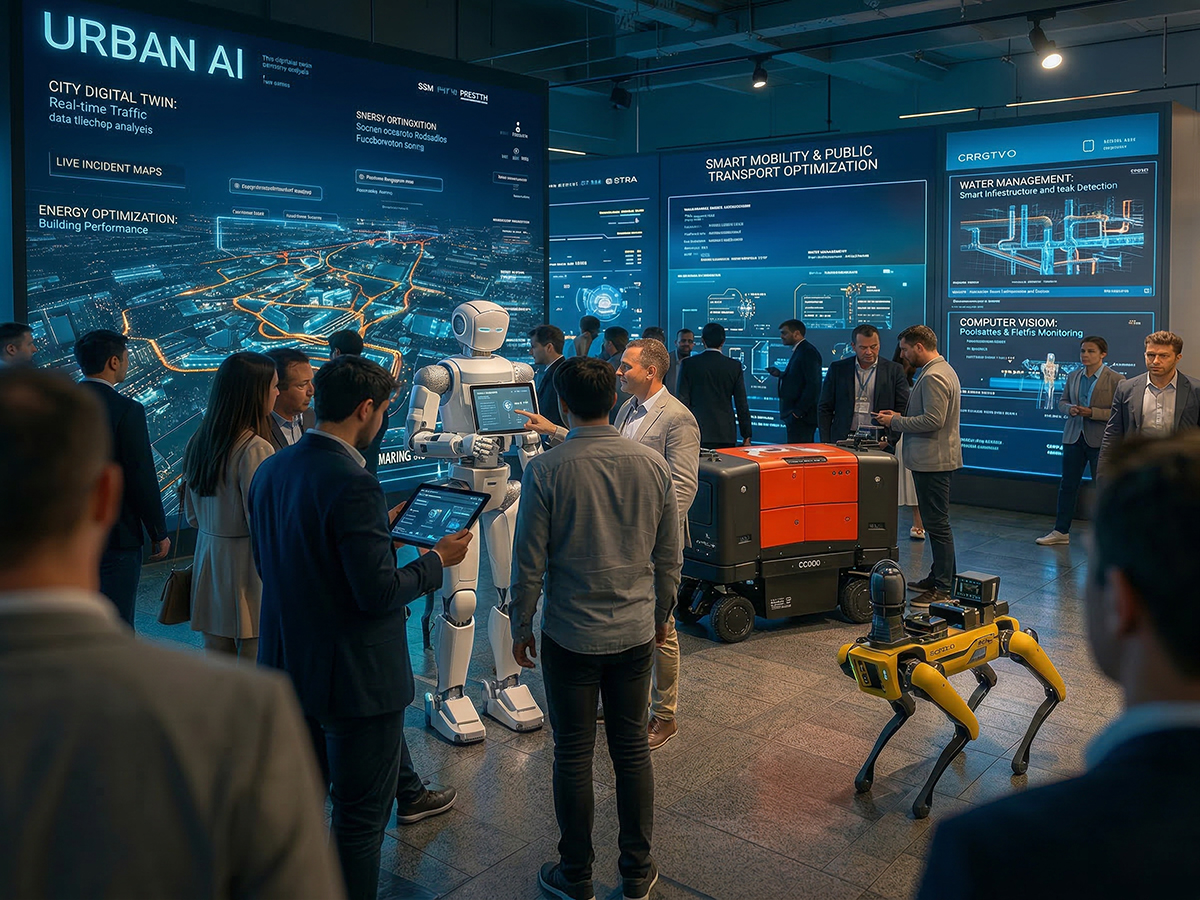
Run a city digital twin from an immersive command center, testing permitting, emergency response, and daily operations as recommendations change under pressure.
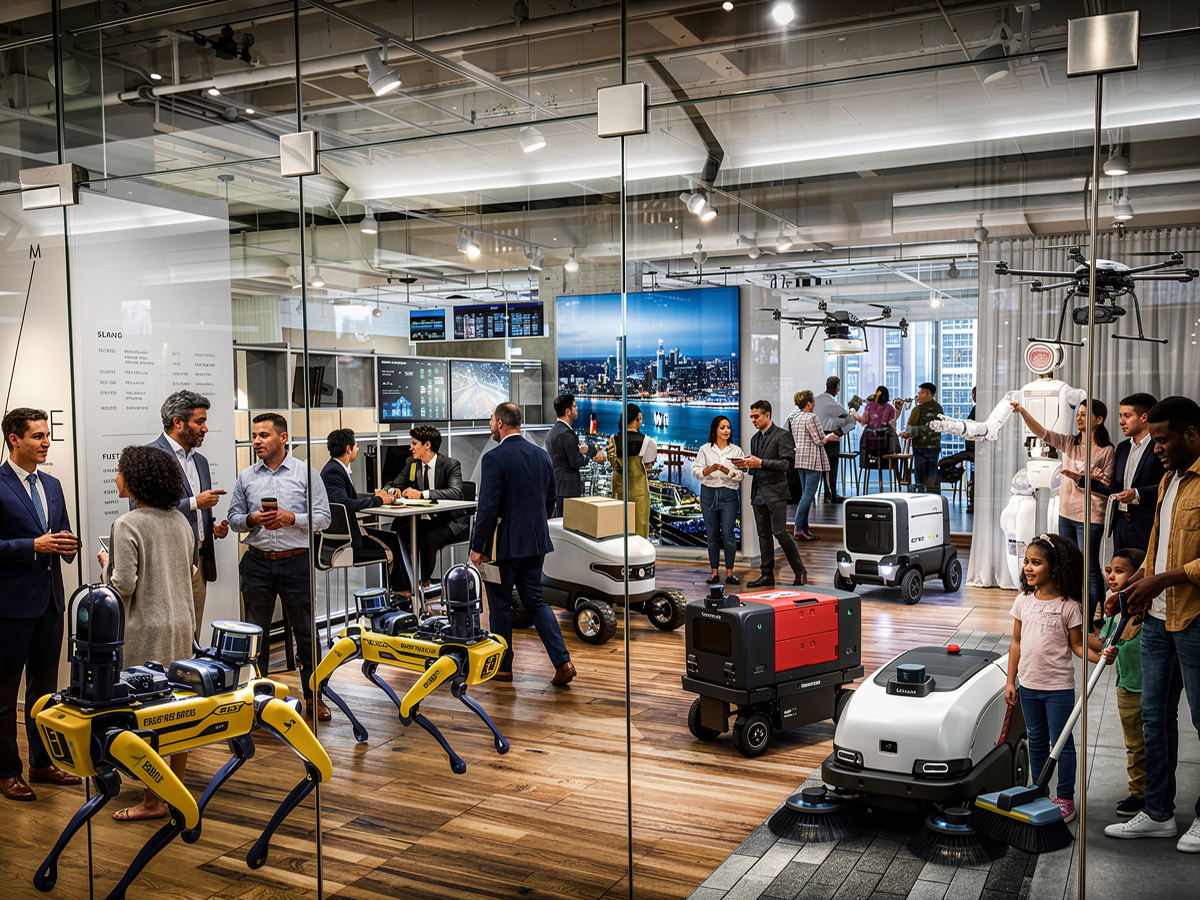
Direct inspection, delivery, cleaning, maintenance, and emergency robots through real street and building obstacles, exposing where autonomy succeeds, hesitates, or requires human judgment.
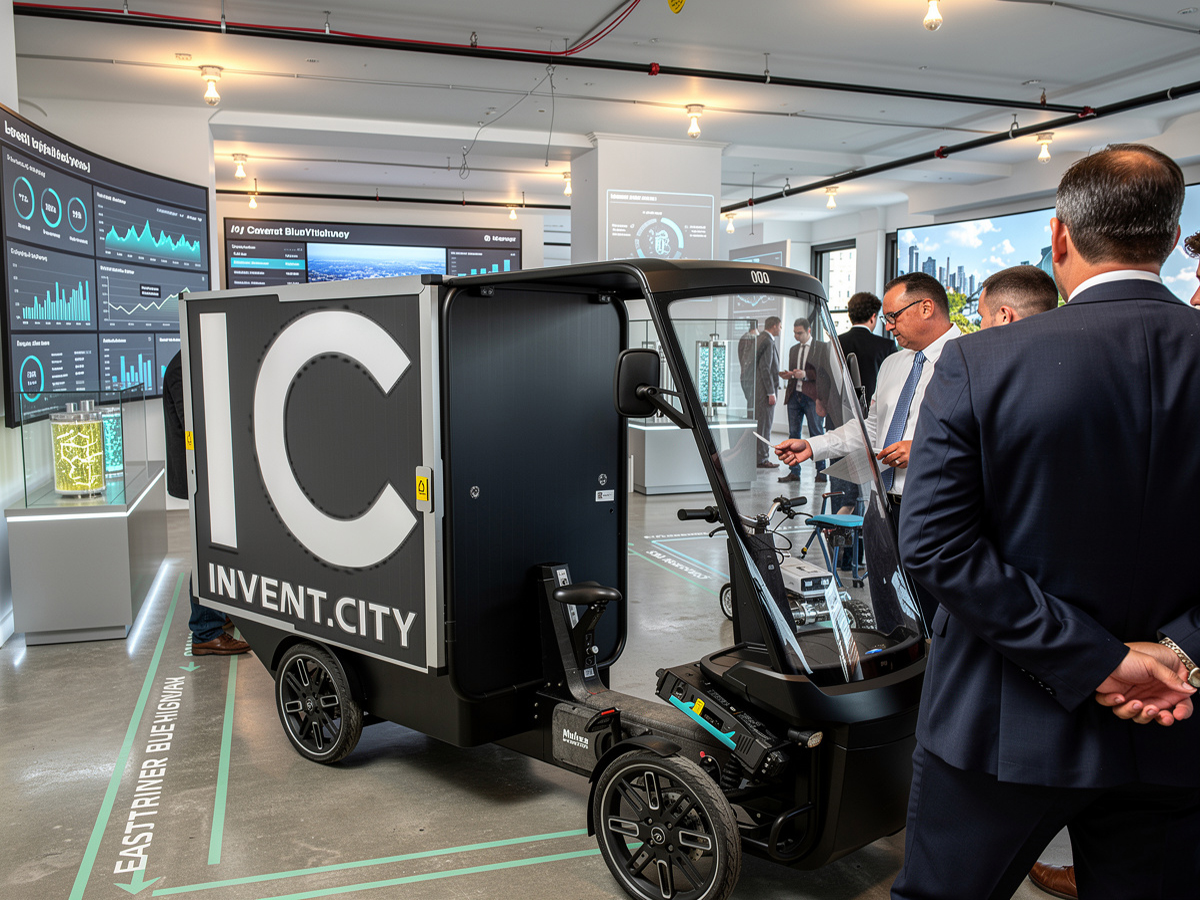
Route one delivery from vessel to microhub, cargo bike, locker, and electric fleet, seeing how each handoff affects the curb and final mile.
The virtual Mart complements the physical one. Digital media, virtual showrooms and events will extend it beyond FiDi, across time zones, 24 hours a day. Before a visit, buyers can explore solutions, find suppliers and book meetings. After, they can revisit demos, share them with colleagues and keep purchases and pilots moving. Media draws new audiences and events bring buyers back. FiDi will anchor a market that is .


A cluster needs room to grow, and FiDi has it: about of direct and sublease vacancy in the project area in Q2 2026, per Cushman & Wakefield, much of it poorly suited to housing. The planning case assigns 1 Million Square Feet to the Trade Mart and 2 Million to supporting offices. Existing space lets the cluster launch fast, start cheap and grow with demand. remain vital where buildings fit; for floors that don’t, showrooms offer another use.

Buyers commit when they see a solution working, and FiDi already has public proof. At Chambers Street, the MTA and NYC DCAS are exploring a thermal-energy system that could capture subway heat for nearby municipal buildings. FiDi also hosts a freight microhub, Blue Highway marine freight and coastal-resilience work. Invent.City will add projects of its own, such as the urban hub, and link public initiatives with suppliers, buyers and investors to grow a wider market.

The cluster, anchored by the Trade Mart, will lay the foundation for a bigger goal: making FiDi a model city. The Trade Mart is the first act of . Unlike greenfield cities built from scratch, Invent.City will retrofit a working district, the problem most of the world’s cities actually face. Over time it will add housing, low-impact transportation and urban-agriculture jobs supplying neighborhood food markets, and become a template for AI in city operations.

NEOM

Telosa

Singapore

Curitiba

Masdar City

Songdo

FiDi will become a real-world lab. Companies will demonstrate technologies in a dense, working district while city teams evaluate them for purchase. The lab will connect clean energy, water reuse, rooftop food, car-free streets and mobility with neighborhood hubs for deliveries, waste and public toilets. Neighbors in Community Board 1, the Alfred E. Smith Houses, Chinatown, Battery Park City and Tribeca will help decide what gets tested and scaled. Together, they will show how a city works better.

The Trade Mart will bring tenants, buyers and visitors to FiDi year-round, local businesses, demand for space and street life. A could link the showrooms with places to walk, meet and spend time. Reclaiming the Streets and Vision Zero Reimagined offer more ideas for Lower Manhattan’s public space and street safety.
Four moves turn strategy into action. Build momentum with roundtables, a newsletter and the Future City exhibition. Fund growth in phases, matching risk to capital. Recruit the partners who deliver. Pick the FiDi sites where the market takes root.
Roundtables will test demand one issue at a time, building on a 2023–2024 market test on micro cargo and urban hubs. They will follow the Trade Mart's structure: the industries that supply cities and the forces shaping their future. Each will target one risk or opportunity, and AI will run through all of them.
Each session will bring buyers, suppliers and investors together around a single issue and publish the buyer needs, potential pilots and next steps it identifies.
The series is set for early 2027.


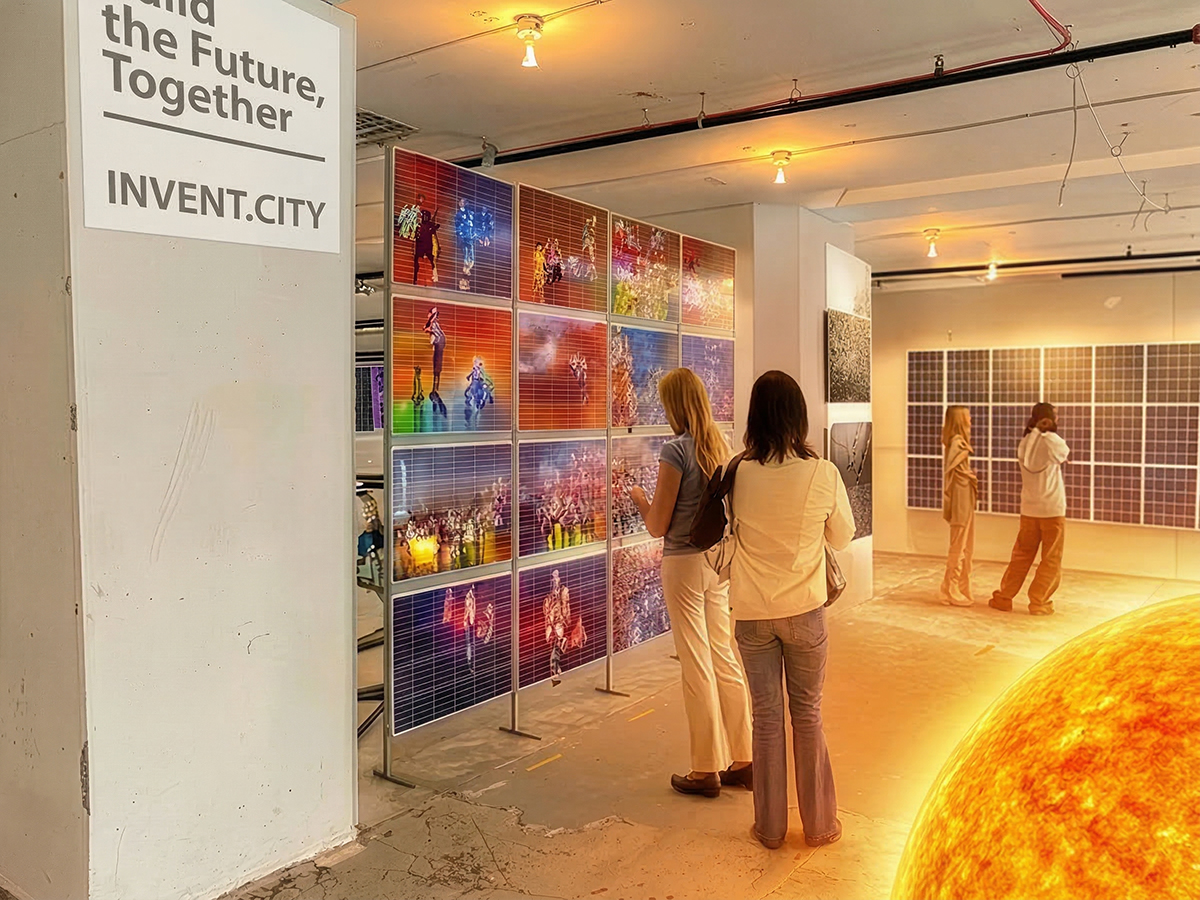
Invent.City’s planned Future City exhibition will show how the decisions cities make today shape life for generations.
Organized around twelve industries and the forces transforming cities, especially , it will use immersive visions of New York, Lagos and London in 2100 to explore and futures.
Funded primarily by sponsors, the exhibition will give companies a stage to demonstrate solutions and meet visitors, buyers, researchers and future Trade Mart exhibitors. The website and monthly newsletter will extend its reach between visits and build participation in the exhibition, the Trade Mart and the cluster.
FiDi already draws the audience. The Downtown Alliance reports 11.3 million unique visitors to Lower Manhattan in 2024, people who neither work nor live downtown. The exhibition will give them a new reason to come: to experience the future of cities and meet the companies building it.
| Submarket | Address | Available Space | Details |
|---|---|---|---|
| Financial East | 28 Liberty Street | 186,469 SF | Class A tower; contact JLL for availability details. |
| Financial East | 17 State Street | 72,405 SF | Class A office tower at State and Pearl Streets. |
| Financial East | One New York Plaza | 35,382 SF | Class A office tower at the southern tip of Manhattan. |
| Insurance | 33 Maiden Lane | 24,200 SF | Full second floor; direct lease, rent negotiable. |
| Insurance | 125 Maiden Lane | 18,200 SF | Full 14th floor; direct lease, rent negotiable. |
New York is the world’s leading financial center, ranked first in the Global Financial Centres Index. The project area includes the New York Stock Exchange, steps from the Federal Reserve Bank of New York and global bank headquarters. Invent.City will put that capital to work, connecting banks, private equity, venture capital, infrastructure funds and public finance to each phase of the Trade Mart and to the projects cities buy there. will co-invest in showrooms and projects.
Funding the Platform

Invent.City will recruit investors, sponsors, public agencies, nonprofits, companies and incubators. Each brings capital, buyers, evidence or delivery; the Trade Mart gives them one place to work together.
Grow Partnerships

Invent.City scores FiDi buildings and public spaces on visibility, access, flexibility, cost, ownership readiness and event capacity. A three-stage identifies anchor buildings and smaller sites for phased openings. Invent.City will expand the portfolio as demand proves out.
Cities will test solutions against real needs, suppliers will reach buyers at scale, and New York will gain jobs, visitors and working space. The base case: 13,173 jobs and $2.4B a year in direct activity.
Base planning scenario: 13,173 jobs; $2.4B in annual direct economic activity; $219M in annual modeled taxes and fees; 700K annual visitors; and 3 Million Square Feet of real-estate capacity.
This is a planning scenario, not a forecast. Activity, taxes and visitor spending are annual flows. Space is capacity, and $71M is gross recurring capacity, not net new revenue. These measures describe different outcomes; do not add them.


| Base-case annual public revenue reconciliation | Amount |
|---|---|
| Tourism taxes and feesFrom 4.1, excluding tourism PIT | $ 86,751,875 |
| Trade Mart modeled public revenueFrom 4.2, including payroll-related and sales taxes | $ 132,569,719 |
| Gross recurring NYC real-estate revenue capacityFrom 4.3; gross capacity, not net incremental revenue | $ 70,675,722 |
The visitor case models volume, stay, spending, taxability and jobs. The Trade Mart case models area, job density, wages, procurement and tax rates. The real-estate case models rent, operating costs, capitalization, assessment, tax rates, phase-in and commercial rent tax.
Sections 4.1–4.3 publish the assumptions, formulas and sources. Existing assessments, taxes, exemptions, abatements and transitional values remain outside the real-estate estimate.
| Tourism summary | Downside | Base | Upside |
|---|---|---|---|
| Annual visitorsFrom 4.1.2 Details: Table 1, Base assumptions | 400,000 | 700,000 | 1,000,000 |
| Traveler spending ($/yr)From 4.1.2 Details: Table 2A, Hotel and other traveler spending | $379,000,000 | $864,500,000 | $1,620,000,000 |
| Total economic impact ($/yr)From 4.1.2 Details: Table 2B, Total economic impact | $576,080,000 | $1,314,040,000 | $2,462,400,000 |
| Tourism-supported jobsFrom 4.1.2 Details: Table 3, Tourism-supported jobs | 2,706 | 6,173 | 11,567 |
| Modeled taxes and fees ($/yr, no PIT)From 4.1.2 Details: Table 4C, Tax totals roll-up | $38,518,438 | $86,751,875 | $160,889,063 |
| Rounded taxes and fees ($/yr, no PIT)From 4.1.2 Details: Table 4C, rounded grand total | $38.5M | $86.8M | $160.9M |
| Tourism PIT is excluded pending a separate tourism wage-and-residency model. Jobs scale with direct traveler spending using NYC's 2025 spending-to-jobs ratio. Scenarios assume 1.25 guests per occupied room and a 75% taxable share of non-hotel spending. | |||
| Trade Mart summary | Base |
|---|---|
| On-site jobs (1,000 showroom + 6,000 supporting offices)From 4.2.2 Details: Table 1, Jobs based on area | 7,000 |
| On-site payroll ($/yr)From 4.2.2 Details: Table 2B, Base-case payroll detail | $1,165,000,000 |
| Local procurement ($/yr)From 4.2.2 Details: Table 3, Local procurement | $349,500,000 |
| Total direct activity ($/yr)From 4.2.2 Details: Table 4, Direct campus activity | $1,514,500,000 |
| Note: Direct activity shown here is kept separate from tourism and real-estate modules to reduce double counting. | |
That 3 Million Square Feet is 1 Million Square Feet of Trade Mart plus the 2 Million Square Feet of supporting offices it draws. Invent.City will put empty space back to work in phases, not all at once.
| Real estate summary | Downside | Base | Upside |
|---|---|---|---|
| Stabilized leased area (sf)From 4.3.2 Details: Table 1, Leasing assumptions | 3,000,000 | 3,000,000 | 3,000,000 |
| Annual rent ($/yr)From 4.3.2 Details: Tables 1 and 1A, rent total | $165,000,000 | $165,000,000 | $165,000,000 |
| NOI ($/yr)From 4.3.2 Details: Table 2B, Total NOI on 3.0 MSF | $102,000,000 | $106,860,000 | $111,750,000 |
| Illustrative implied value at 6.0% cap ($)From 4.3.2 Details: Table 2C, Implied value from capitalized NOI | $1,700,000,000 | $1,781,000,000 | $1,862,500,000 |
| Modeled recurring NYC revenue capacity ($/yr)From 4.3.2 Details: Table 4C, Total modeled recurring NYC revenue capacity | $66,744,900 | $70,675,722 | $74,303,100 |
| Rounded recurring NYC revenue capacity ($/yr)From 4.3.2 Details: Table 4C, rounded total | $66.7M | $70.7M | $74.3M |
| Gross capacity is shown separately from modeled taxes and fees because current assessments, existing taxes, exemptions, abatements, and transitional values have not been deducted. | |||

Well-designed pedestrianization can turn streets from transportation corridors into productive economic space—supporting retail, restaurants, events, longer dwell times, and stronger real-estate demand.
| Times Square, New York City | After Broadway was converted into pedestrian plazas, street-level retail rents in the Times Square plaza area doubled between 2009 and 2012, while more visitors reported shopping in the district. Source: NYC Department of City Planning. |
|---|---|
| Gran Vía, Madrid | Expanded pedestrian space and reduced car access helped increase holiday-period spending by about 9.5%, compared with 3.3% citywide. Source: Madrid City Council. |
| Strøget, Copenhagen | Beginning in 1962, Copenhagen progressively converted its central shopping streets to pedestrian use, dramatically increasing pedestrian space, outdoor activity, and the commercial vitality of the city center. |
The lesson for FiDi: pedestrian streets can function as economic infrastructure—places to demonstrate products, hold markets and events, dine, meet, shop, and spend time rather than simply pass through.


